import numpy as np
import matplotlib.pyplot as plt
from scipy.stats import norm

x = np.linspace(-3, 3, 1000)

pdf = norm.pdf(x, 0, 1)
plt.plot(x, pdf, label='Normal Distribution')
plt.show()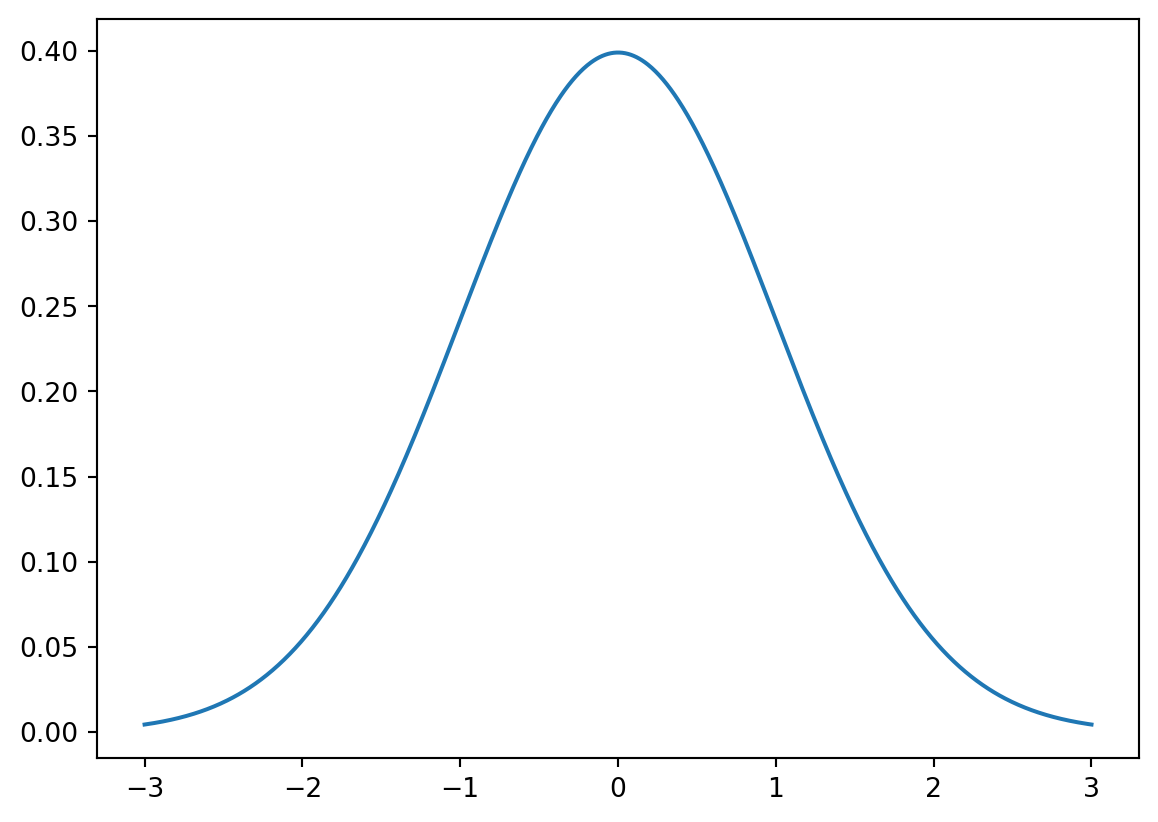
You can choose to render a document in multiple formats (see </> Code on the top right).
For instance, this file is rendered both in html and ipynb.
So now, you can download your file notebook.ipynb and then load it on Jupyter.
import numpy as np
import matplotlib.pyplot as plt
from scipy.stats import norm

x = np.linspace(-3, 3, 1000)

pdf = norm.pdf(x, 0, 1)
plt.plot(x, pdf, label='Normal Distribution')
plt.show()import numpy as np
import matplotlib.pyplot as plt
from scipy.stats import norm
x = np.linspace(-3, 3, 1000)
pdf = norm.pdf(x, 0, 1)
plt.plot(x, pdf, label='Normal Distribution')
plt.show()