library(dplyr)
library(ggplot2)
library(leaflet)Executed R - Example
Example of a web page with executed R code
1 R
To render files including R code, you have to :
-
- example :
install.packages(c('rmarkdown', 'dplyr', 'ggplot2'))
- example :
TipInstall R packages
Using Git Bash dans file DESCRIPTION:
Rscript -e "install.packages('devtools', repos='https://cloud.r-project.org')"Rscript -e 'devtools::install_deps(dependencies = TRUE)'
1.1 Documentation
2 Cells
To write code cells, the principle is the same as with Python.
Simply replace Python with R between the braces.
2.1 Load packages
A good practice is to load all packages at the beginning.
ImportantDeploy on GitHub pages
Don’t forget to add your libraries into the file called DESCRIPTION at the reposiroty root.
This file is essential to list all needed packages when you run GitHub actions.
2.2 First cell
Imagine you want to draw a spiral.
theta <- seq(0, 8 * pi, length.out = 1000)
r <- 0.5 * theta

data <- data.frame(theta = theta, r = r)
data$x <- data$r * cos(data$theta)
data$y <- data$r * sin(data$theta)

ggplot(data, aes(x, y)) +
  geom_path(color = "darkcyan", linewidth = 1.5)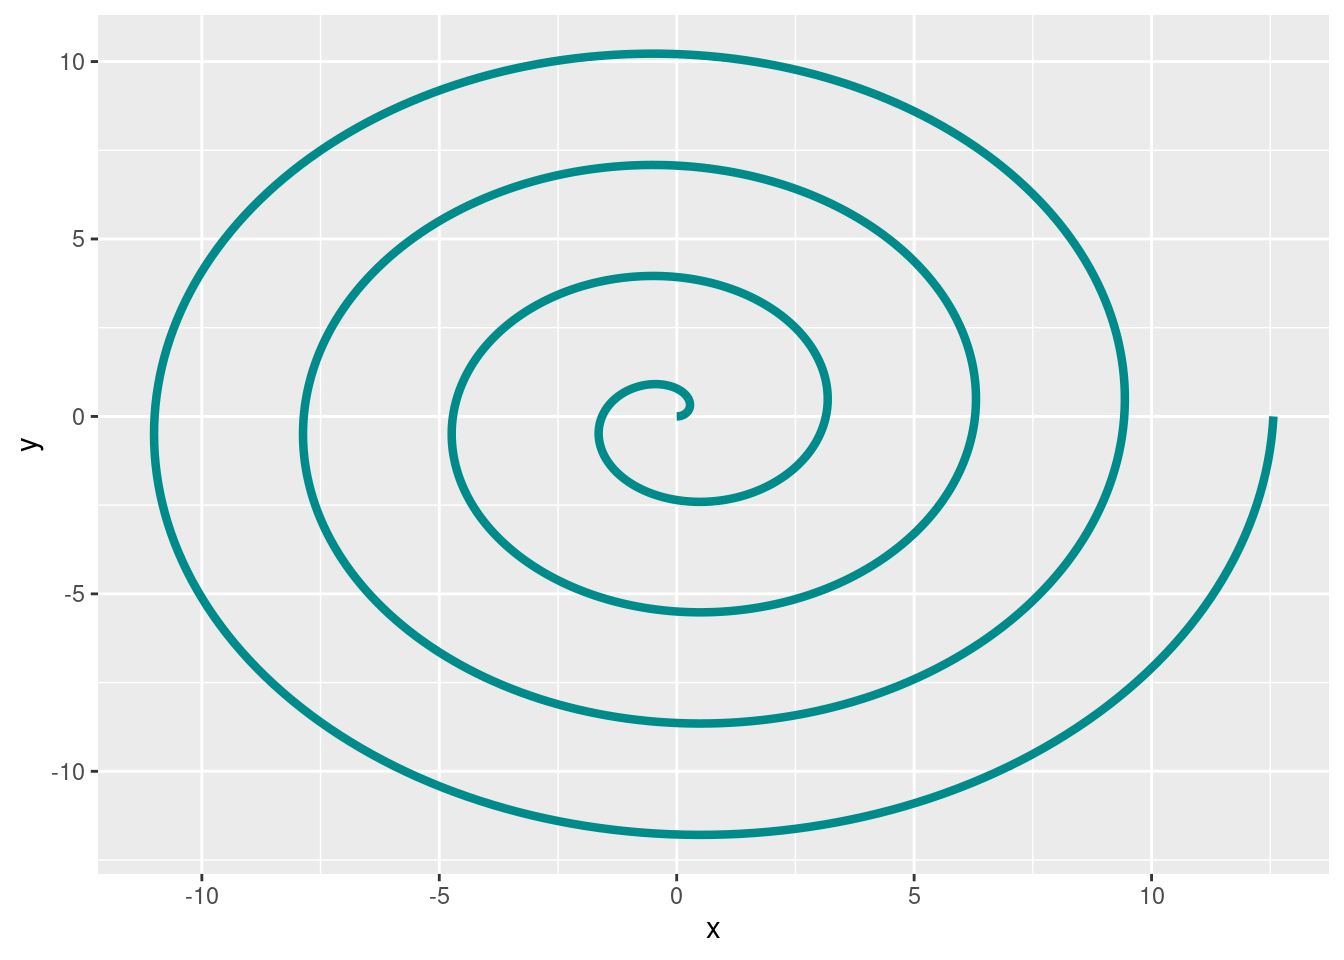
You cannot see it in the output code but i add those options at the beginning :
```{r}
#| label: fig-spiral
#| fig-cap: A wonderfull spiral
theta <- seq(0, 8 * pi, length.out = 1000)
r <- 0.5 * theta
...
```
So you can use the label and reference the figure elsewhere:
- Figure 1 with this code :
@fig-spiral - my wonderfull spiral with this code :
[my wonderfull spiral](#fig-spiral)
3 Tabulations
set.seed(42)
pairs <- data.frame(x = runif(10), y = runif(10))

ggplot(pairs, aes(x, y)) +
  geom_point(color = "darkcyan", alpha = 0.7) +
  labs(x = "X", y = "Y")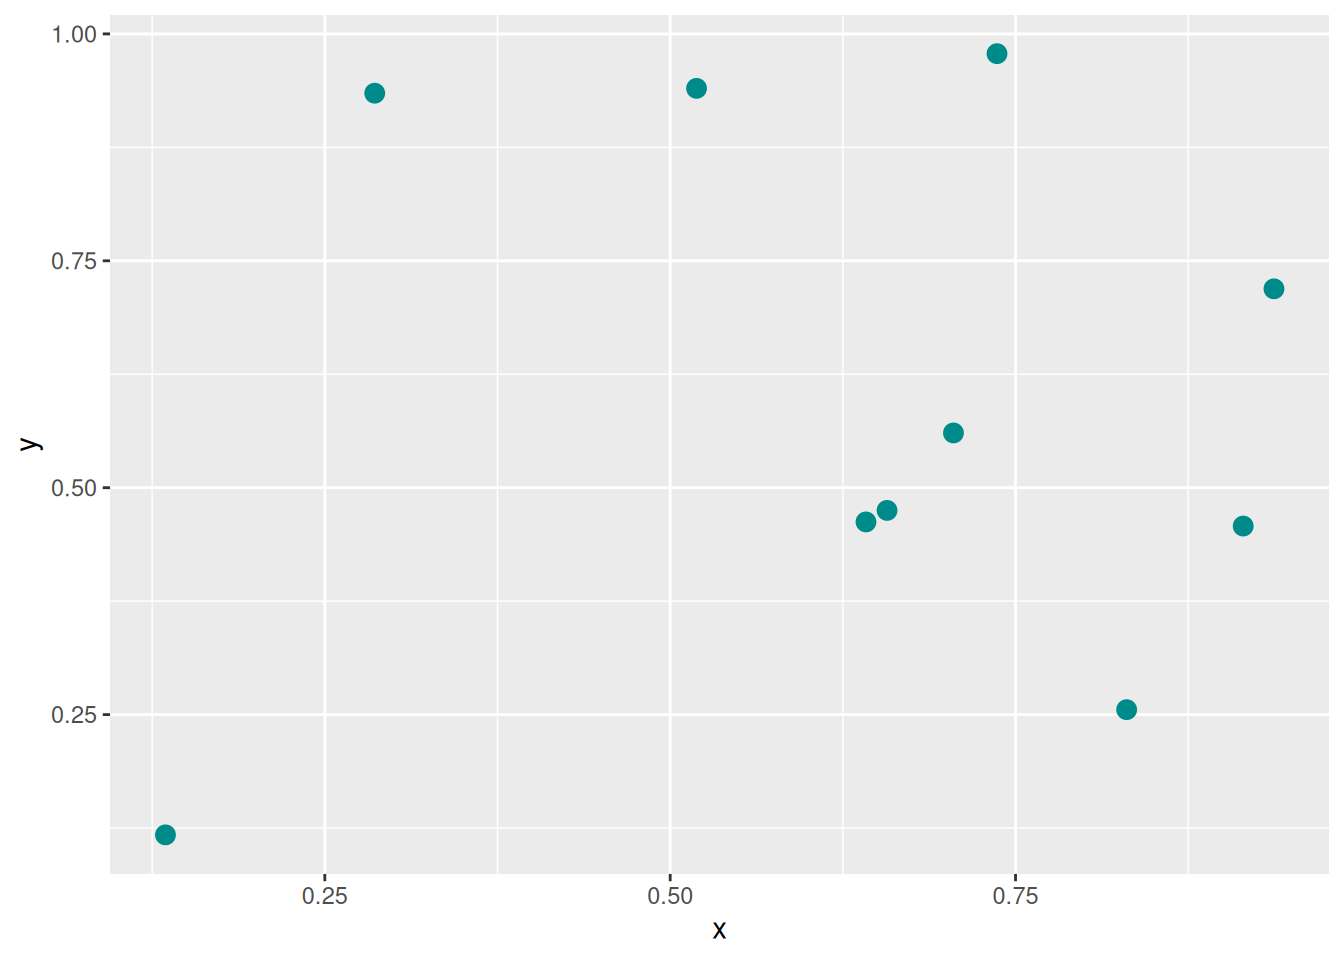
knitr::kable(pairs)| x | y |
|---|---|
| 0.9148060 | 0.4577418 |
| 0.9370754 | 0.7191123 |
| 0.2861395 | 0.9346722 |
| 0.8304476 | 0.2554288 |
| 0.6417455 | 0.4622928 |
| 0.5190959 | 0.9400145 |
| 0.7365883 | 0.9782264 |
| 0.1346666 | 0.1174874 |
| 0.6569923 | 0.4749971 |
| 0.7050648 | 0.5603327 |
4 Inline code
You can display variable values in text.
ages <- c(20, 25, 30, 40)The average age is 28.75.
5 Interactive Maps
You can include maps using library Leaflet.
leaflet() %>%
  setView(lng=2.6, lat=46.5, zoom=5) %>%
  addTiles() %>%
  addMarkers(lng=-1.7419, lat=48.0507, popup="ENSAI")