! cat /opt/spark/conf/spark-defaults.confFirst steps with Spark - Correction
Lab 1
execute: eval: false
1 Create a Spark session
1.1 Only on SSPCloud
See default configuration on the datalab :
To modify the config :
import os
from pyspark.sql import SparkSession

spark = (SparkSession
         .builder
         # default url of the internally accessed Kubernetes API
         # (This Jupyter notebook service is itself a Kubernetes Pod)
         .master("k8s://https://kubernetes.default.svc:443")
         # Executors spark docker image: for simplicity reasons, this jupyter notebook is reused
         .config("spark.kubernetes.container.image", os.environ['IMAGE_NAME'])
         # Name of the Kubernetes namespace
         .config("spark.kubernetes.namespace", os.environ['KUBERNETES_NAMESPACE'])
         # Allocated memory to the JVM
         # Stay careful, by default, the Kubernetes pods has a higher limit which depends on other parameters.
         .config("spark.executor.memory", "4g")
         .config("spark.kubernetes.driver.pod.name", os.environ['KUBERNETES_POD_NAME'])
         # dynamic allocation configuration
         .config("spark.dynamicAllocation.enabled","true")
         .config("spark.dynamicAllocation.initialExecutors","1")
         .config("spark.dynamicAllocation.minExecutors","1")
         .config("spark.dynamicAllocation.maxExecutors","10")
         .getOrCreate()
        )
# See the current number of executors (one for now)
!kubectl get pods -l spark-role=executor1.2 Only on AWS
#Spark session
spark

# Configuraion
spark._jsc.hadoopConfiguration().set("fs.s3.useRequesterPaysHeader","true")
1.3 Check spark session
spark2 First steps with Spark - Data importation
Spark’s main object class is the DataFrame, which is a distributed table. It is analogous to R’s or Python (Pandas)’s data frames:
- one row represents an observation,
- one column represents a variable.
But contrary to R or Python, Spark’s DataFrames can be distributed over hundred of nodes.
Spark support multiple data formats, and multiple ways to load them.
- data format : csv, json, parquet (an open source column oriented format)
- can read archive files
- schema detection or user defined schema. For static data, like a json file, schema detection can be use with good results.
Spark has multiple syntaxes to import data. Some are simple with no customisation, others are more complexes but you can specify options.
The simplest syntaxes to load a json or a csv file are :
# JSON
json_df = spark.read.json([location of the file])
# csv
csv_df = spark.read.csv([location of the file])
In the future, you may consult the Data Source documentation to have the complete description of Spark’s reading abilities.
The data you will use in this lab are real data from the twitter sampled stream API and filtered stream API. The tweets folder contains more than 50 files and more than 2 million tweets. The tweets was collected between the 14/04/2021 and the 18/04/2021. The total collection time was less than 10 hours.
2.1 ✍Hands-on 1 - Data importation
-
s3a://ludo2ne/diffusion/tweets.jsonl.gzfor SSPClouds3://spark-lab-input-data-ensai20222023/tweets/tweets20220324-155940.jsonl.gzfor AWS
JSONL(JSON-line) format, which means that each line of it is a JSON object. A JSON object is just a Python dictionary or a JavaScript object and looks like this:{ key1: value1, key2: ["array", "of", "many values]}). This file has been compressed into aGZarchive, hence the.jsonl.gzending. Also this file is not magically appearing in your S3 storage. It is hosted on one of your teacher’s bucket and has been made public, so that you can access it.
It’s possible to load multiple file in a unique DataFrame. It’s useful when you have daily files and want to process them all. It’s the same syntax as the previous one, just specify a folder.
- SSPCloud users : if you meet some issue to load this file, you can load and use your own file :
- In Onyxia,
mes fichiers - Load file
tweets.jsonl.gz - In Jupyter, read it using
s3a://<user_name>/tweets.jsonl.gz
- In Onyxia,
# DataFrame creation
df_tweet = spark.read.json("s3a://ludo2ne/diffusion/tweets.jsonl.gz")
# or df_tweet = spark.read.json("s3://spark-lab-input-data-ensai20222023/tweets/tweets20220324-155940.jsonl.gz")

# caching
df_tweet.cache()
3 Data frame basic manipulations
If DataFrames are immutable, they can however be transformed in other DataFrames, in the sense that a modified copy is returned. Such transformations include: filtering, sampling, dropping columns, selecting columns, adding new columns…
First, you can get information about the columns with:
df.columns       # get the column names
df.schema        # get the column names and their respective type
df.printSchema() # same, but human-readable
You can select columns with the select() method. It takes as argument a list of column name. For example :
df_with_less_columns = df\
  .select("variable3","variable_four","variable-6")

# Yes, you do need the ugly \ at the end of the line,
# if you want to chain methods between lines in Python
You can get nested columns easily with :
df.select("parentField.nestedField")To filter data you could use the filter() method. It take as input an expression that gets evaluated for each observation and should return a boolean. Sampling is performed with the sample() method. For example :
df_with_less_rows = df\
  .sample(fraction=0.001)\
  .filter(df.variable1=="value")\
  .show(10)
As said before your data are distributed over multiple nodes (executors) and data inside a node are split into partitions. Then each transformations will be run in parallel. They are called narrow transformation For example, to sample a DataFrame, Spark sample every partitions in parallel because sample all partition produce the sample DataFrame. For some transformations, like groupBy() it’s impossible, and it’s cannot be run in parallel.
3.1 Lazy evaluation
This is because Spark has what is known as lazy evaluation, in the sense that it will wait as much as it can before performing the actual computation. Said otherwise, when you run an instruction such as:
tweet_author_hashtags = df_tweet_big.select("auteur","hashtags")… you are not executing anything! Rather, you are building an execution plan, to be realised later.
Spark is quite extreme in its laziness, since only a handful of methods called actions, by opposition to transformations, will trigger an execution. The most notable are:
collect(), explicitly asking Spark to fetch the resulting rows instead of to lazily wait for more instructions,take(n), asking fornfirst rowsfirst(), an alias fortake(1)show()andshow(n), human-friendly alternativescount(), asking for the numbers of rows- all the “write” methods (write on file, write to database), see here for the list
This has advantages: on huge data, you don’t want to accidently perform a computation that is not needed. Also, Spark can optimize each stage of the execution in regard to what comes next. For instance, filters will be executed as early as possible, since it diminishes the number of rows on which to perform later operations. On the contrary, joins are very computation-intense and will be executed as late as possible. The resulting execution plan consists in a directed acyclic graph (DAG) that contains the tree of all required actions for a specific computation, ordered in the most effective fashion.
This has also drawbacks. Since the computation is optimized for the end result, the intermediate stages are discarded by default. So if you need a DataFrame multiple times, you have to cache it in memory because if you don’t Spark will recompute it every single time.
3.2 ✍Hands-on 2 - Data frame basic manipulations
df_tweet.count()df_tweet.columnsdf_tweet.printSchema()df_tweet.show(10)-
- Create a new DataFrame named
df_tweet_sampled. - If computations take too long on the full DataFrame, use this one instead or add a sample transformation in your expression.
- Create a new DataFrame named
df_tweet_sampled = df_tweet\
  .sample(fraction=0.1)

df_tweet_sampled.count()tweet_author_hashtags = df_tweet.select("auteur", "hashtags")
tweet_author_hashtags.show(5)-
mentionsandurlsare both nested columns inentities
df_tweet\
  .select("auteur",
          "entities.mentions",
          "entities.urls")\
.show(5)df_tweet\
.select("auteur", "contenu", "like_count")\
.filter(df_tweet.like_count >= 1)\
.show(10)4 Basic DataFrame column manipulation
You can add/update/rename column of a DataFrame using spark :
- Drop :
df.drop(columnName : str ) - Rename :
df.withColumnRenamed(oldName : str, newName : str) - Add/update :
df.withColumn(columnName : str, columnExpression)
For example
df_tweet\
  .withColumn(                                        # computes new variable
    "like_rt_ratio",                                  # like_rt_ratio "OVERCONFIDENCE"
    df_tweet.like_count /df_tweet.retweet_count)
See here for the list of all functions available in an expression.
4.1 ✍Hands-on 3 - Basic DataFrame column manipulation
-
- This column is the sum of
like_count,reply_countandretweet_count.
- This column is the sum of
#to get a clearer, cleaner result, I've added filters and deleted columns
df_tweet_interaction_count = df_tweet\
  .drop("other", "entities", "hashtags", "contenu")\
  .filter(df_tweet.like_count >= 1)\
  .filter(df_tweet.retweet_count >= 1)\
  .withColumn(
    "interaction_count",
    df_tweet.like_count + df_tweet.reply_count + df_tweet.retweet_count)

df_tweet_interaction_count\
.show(10)df_tweet\
.drop("other")\
.show(10)5 Advance DataFrame column manipulation
5.1 Array manipulation
Some columns often contain arrays (lists) of values instead of just one value. This may seem surprising but this actually quite natural. For instance, you may create an array of words from a text, or generate a list of random numbers for each observation, etc.
You may create array of values with:
split(text : string, delimiter : string), turning a text into an array of strings
You may use array of values with:
size(array : Array), getting the number of elementsarray_contains(inputArray : Array, value : any), checking if some value appearsexplode(array : Array), unnesting an array and duplicating other values. For instance if you useexplode()over the hashtags value of this DataFrame:Auteur Contenu Hashtags Bob I love #Spark and #bigdata [Spark, bigdata] Alice Just finished #MHrise, best MH ever [MHrise] You will get :
Auteur Contenu Hashtags Hashtag Bob I love #Spark and #bigdata [Spark, bigdata] Spark Bob I love #Spark and #bigdata [Spark, bigdata] bigdata Alice Just finished #MHrise, best MH ever [MHrise] MHrise
All this functions must be imported first :
from pyspark.sql.functions import split, explode, size, array_containsDo not forget, to create a new column, you should use withColumn(). For example :
df.withColumn("new column", explode("array"))✍Hands-on 4 - Array manipulation
from pyspark.sql.functions import split, explode, size, array_contains

df_tweet\
  .filter(size("hashtags") > 0)\
  .select("auteur", "hashtags")\
  .withColumn(
    "hashtag_exploded",
    explode("hashtags"))\
.show(20, False)df_tweet\
.select("auteur", "contenu")\
.withColumn("word_count",
size(split("contenu", " ")))\
.show(10, False)df_tweet\
.filter(array_contains("hashtags", "Ukraine"))\
.count()5.2 User defined function
For more very specific column manipulation you will need Spark’s udf() function (User Defined Function). It can be useful if Spark does not provide a feature you want. But Spark is a popular and active project, so before coding an udf, go check the documentation. For instance for natural language processing, Spark already has some functions. Last things, python udf can lead to performance issues (see https://stackoverflow.com/a/38297050) and learning a little bit of scala or java can be a good idea.
For example :
# !!!! DOES NOT WORK !!!!
def to_lower_case(string):
    return string.lower()

df.withColumn("tweet_lower_case", to_lower_case(df.contenu))
will just crash. Keep in mind that Spark is a distributed system, and that Python is only installed on the central node, as a convenience to let you execute instructions on the executor nodes. But by default, pure Python functions can only be executed where Python is installed! We need udf() to enable Spark to send Python instructions to the worker nodes.
Let us see how it is done :
# imports
from pyspark.sql.functions import udf
from pyspark.sql.functions import explode
from pyspark.sql.types import StringType

# pure python functions
def to_lower_case(string):
    return string.lower()

# user defined function(we use a lambda function to create the udf)
to_lower_case_udf = udf(
    lambda x: to_lower_case(x), StringType()
)

# df manipulation
df_tweet_small\
  .select("auteur","hashtags")\
  .filter("size(hashtags)!=0")\
  .withColumn("hashtag", explode("hashtags"))\
  .withColumn("hashtag", to_lower_case_udf("hashtag")).show(10)
✍Hands-on 5 - User defined function
-
- your function will return an
IntegerTypeand not aStringType
- your function will return an
# imports
from pyspark.sql.functions import udf
from pyspark.sql.types import IntegerType

# pure python functions
def word_count(string):
    return len(string.split(" "))

# user definid function
word_count_udf = udf(
    lambda x: word_count(x), IntegerType()
)

# df manipulation
df_tweet\
  .withColumn("word_count",
              word_count_udf("contenu"))\
  .show(10)
6 Aggregation functions
Spark offer a variety of aggregation functions :
count(column : string)will count every not null value of the specify column. You cant usecount(1)ofcount("*")to count every line (even row with only null values)countDisctinct(column : string)andapprox_count_distinct(column : string, percent_error: float). If the exact number is irrelevant,approx_count_distinct()should be preferred.Counting distinct elements cannot be done in parallel, and need a lot data transfer. But if you only need an approximation, there is a algorithm, named hyper-log-log (more info here) that can be parallelized.
from pyspark.sql.functions import count, countDistinct, approx_count_distinct

df.select(count("col1")).show()
df.select(countDistinct("col1")).show()
df.select(approx_count_distinct("col1"), 0.1).show()
You have access to all other common functions
min(),max(),first(),last(),sum(),sumDistinct(),avg()etc (you should import them firstfrom pyspark.sql.functions import min, max, avg, first, last, sum, sumDistinct)
6.1 ✍Hands-on 6 - Aggregation functions
-
- don’t forget to import the required functions
from pyspark.sql.functions import min, max, avg, first, last, sum, sumDistinct

df_tweet_interaction_count\
  .select(min("interaction_count"),
          max("interaction_count"),
          avg("interaction_count"))\
.first()from pyspark.sql.functions import count, countDistinct, approx_count_distinct
df_tweet\
.select(count("hashtags"),
countDistinct("hashtags"),
approx_count_distinct("hashtags", 0.1),
approx_count_distinct("hashtags",0.01))\
.show()7 Grouping functions
Like SQL you can group row by a criteria with Spark. Just use the groupBy(column : string) method. Then you can compute some aggregation over those groups.
df\
  .groupBy("col1")\
  .agg(count("col2").alias("quantity"))\           # alias is use to specify the name of the new column
  .show()
The agg() method can take multiples argument to compute multiple aggregation at once.
df\
.groupBy("col1")\
.agg(count("col2").alias("quantity"),
min("col2").alias("min"),
avg("col3").alias("avg3"))\
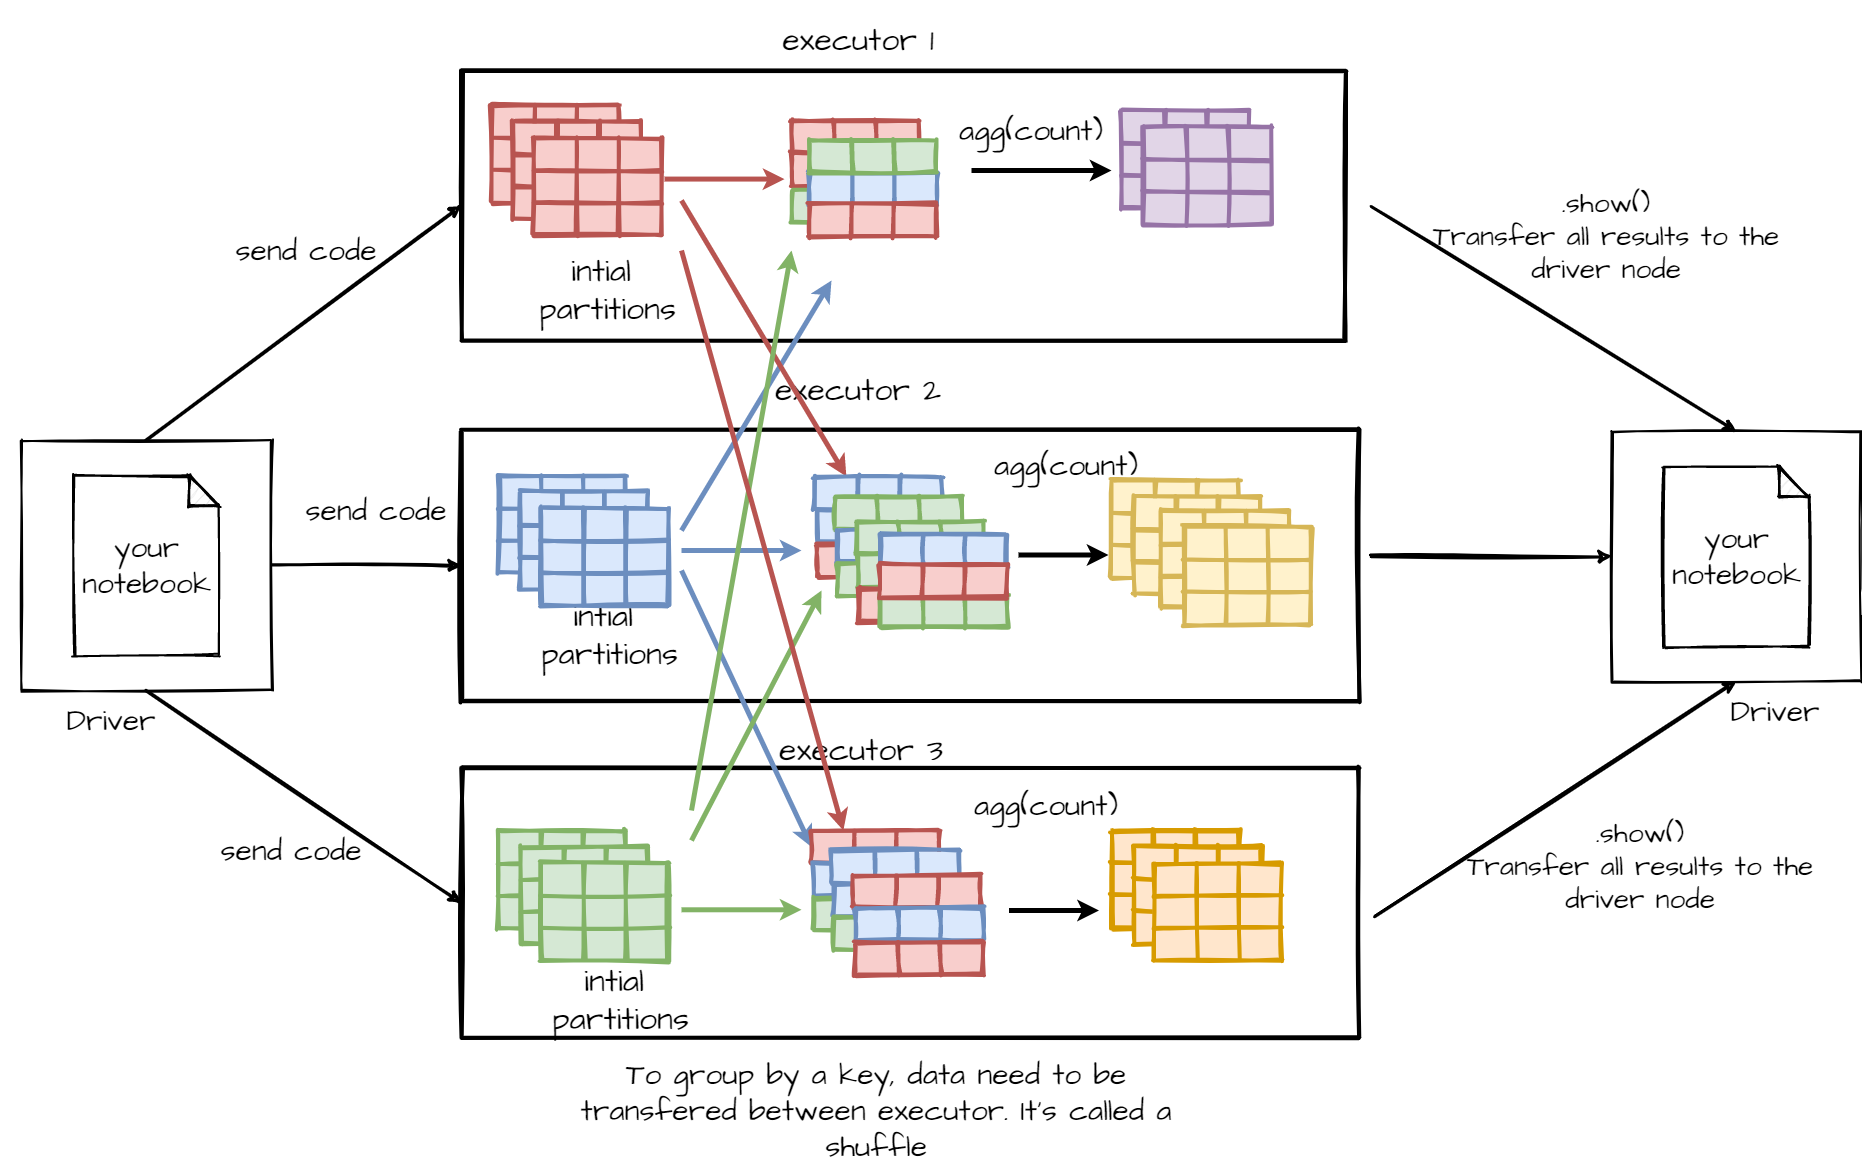
.show()Aggregation and grouping transformations work differently than the previous method like filter(), select(), withColumn() etc. Those transformations cannot be run over each partitions in parallel, and need to transfer data between partitions and executors. They are called “wide transformations”
7.1 ✍Hands-on 7 - Grouping functions
-
- To do that you can use the following syntax
from pyspark.sql.functions import desc
df.orderBy(desc("col"))
from pyspark.sql.functions import desc

df_tweet\
  .groupBy("auteur")\
  .agg(min("retweet_count").alias("min_RT"),
       max("retweet_count").alias("max_RT"),
       avg("retweet_count").alias("avg_RT"))\
  .orderBy(desc("max_RT"))\
  .show(5)
8 Spark SQL
Spark understand SQL statement. It’s not a hack nor a workaround to use SQL in Spark, it’s one a the more powerful feature in Spark. To use SQL you will need :
Register a view pointing to your DataFrame
my_df.createOrReplaceTempView(viewName : str)Use the sql function
spark.sql("""
Your SQL statement
""")
You could manipulate every registered DataFrame by their view name with plain SQL.
In fact you can do most of this tutorial without any knowledge in PySpark nor Spark. Many things can only be done in Spark if you know SQL and how to use it in Spark.
8.1 ✍Hands-on 8 - Spark SQL
# Create a view
df_tweet\
  .select("contenu", "hashtags")\
  .createOrReplaceTempView("view_hashtag_content")
# Run a SQL query
spark.sql("""
SELECT COUNT(*),
COUNT(DISTINCT(contenu))
FROM view_hashtag_content
WHERE size(hashtags) > 0
""")\
.show()df_tweet.createOrReplaceTempView("view_tweet")
spark.sql("""
SELECT auteur,
min(retweet_count),
max(retweet_count),
avg(retweet_count)
FROM view_tweet
GROUP BY auteur
ORDER BY MAX(retweet_count) DESC
""")\
.show(10)End of the Lab
-
- Right click and Download (.ipynb)
- File > Save and Export Notebook > HTML
SSPCloud
AWS
-
- On EMR service page, click on Clusters
- Select the active cluster and click on
Terminate